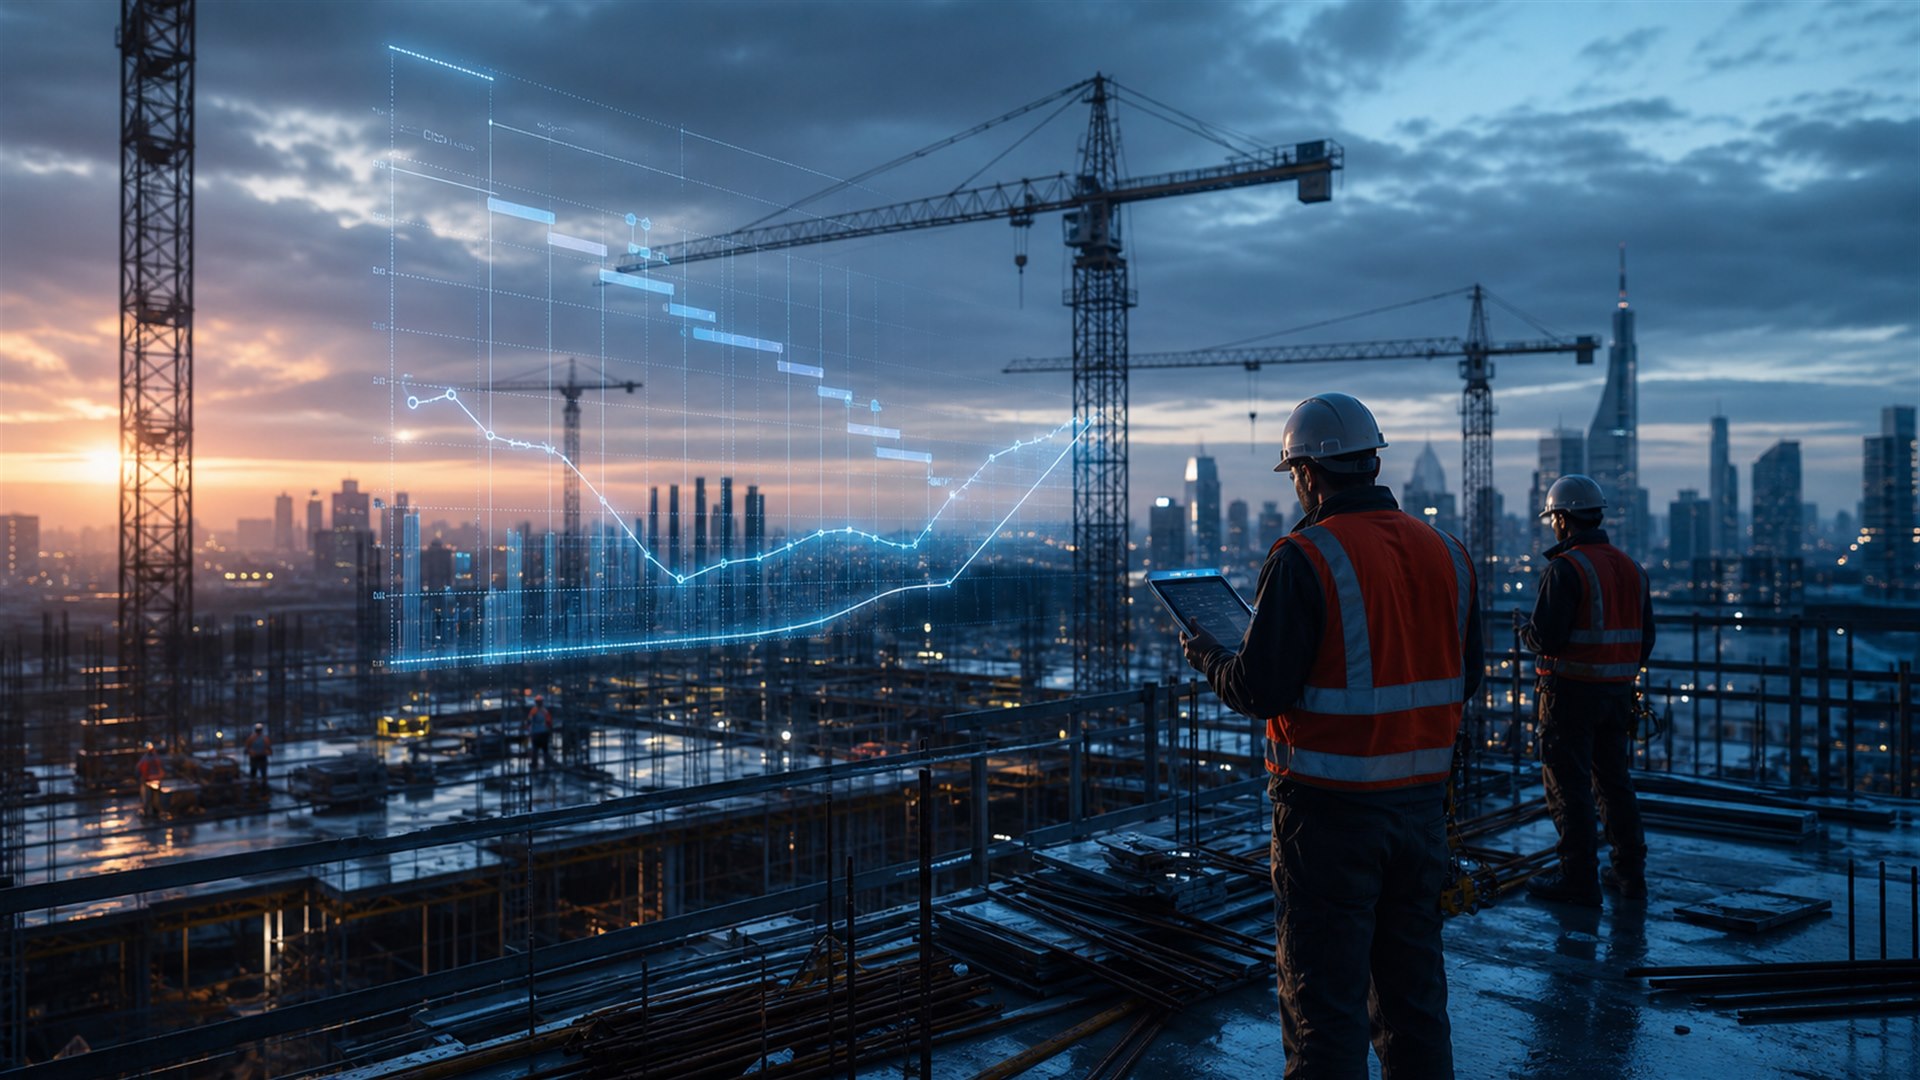



Control tower
Planning, supply and delivery in one live view.
Four practices spanning source, make and deliver.

For operations and supply chain leaders fighting fires across planning, supply and delivery: we build the visibility and control tower to…
For procurement and finance leaders who know the savings are in the data but cannot see them: we turn fragmented spend into a quantified…

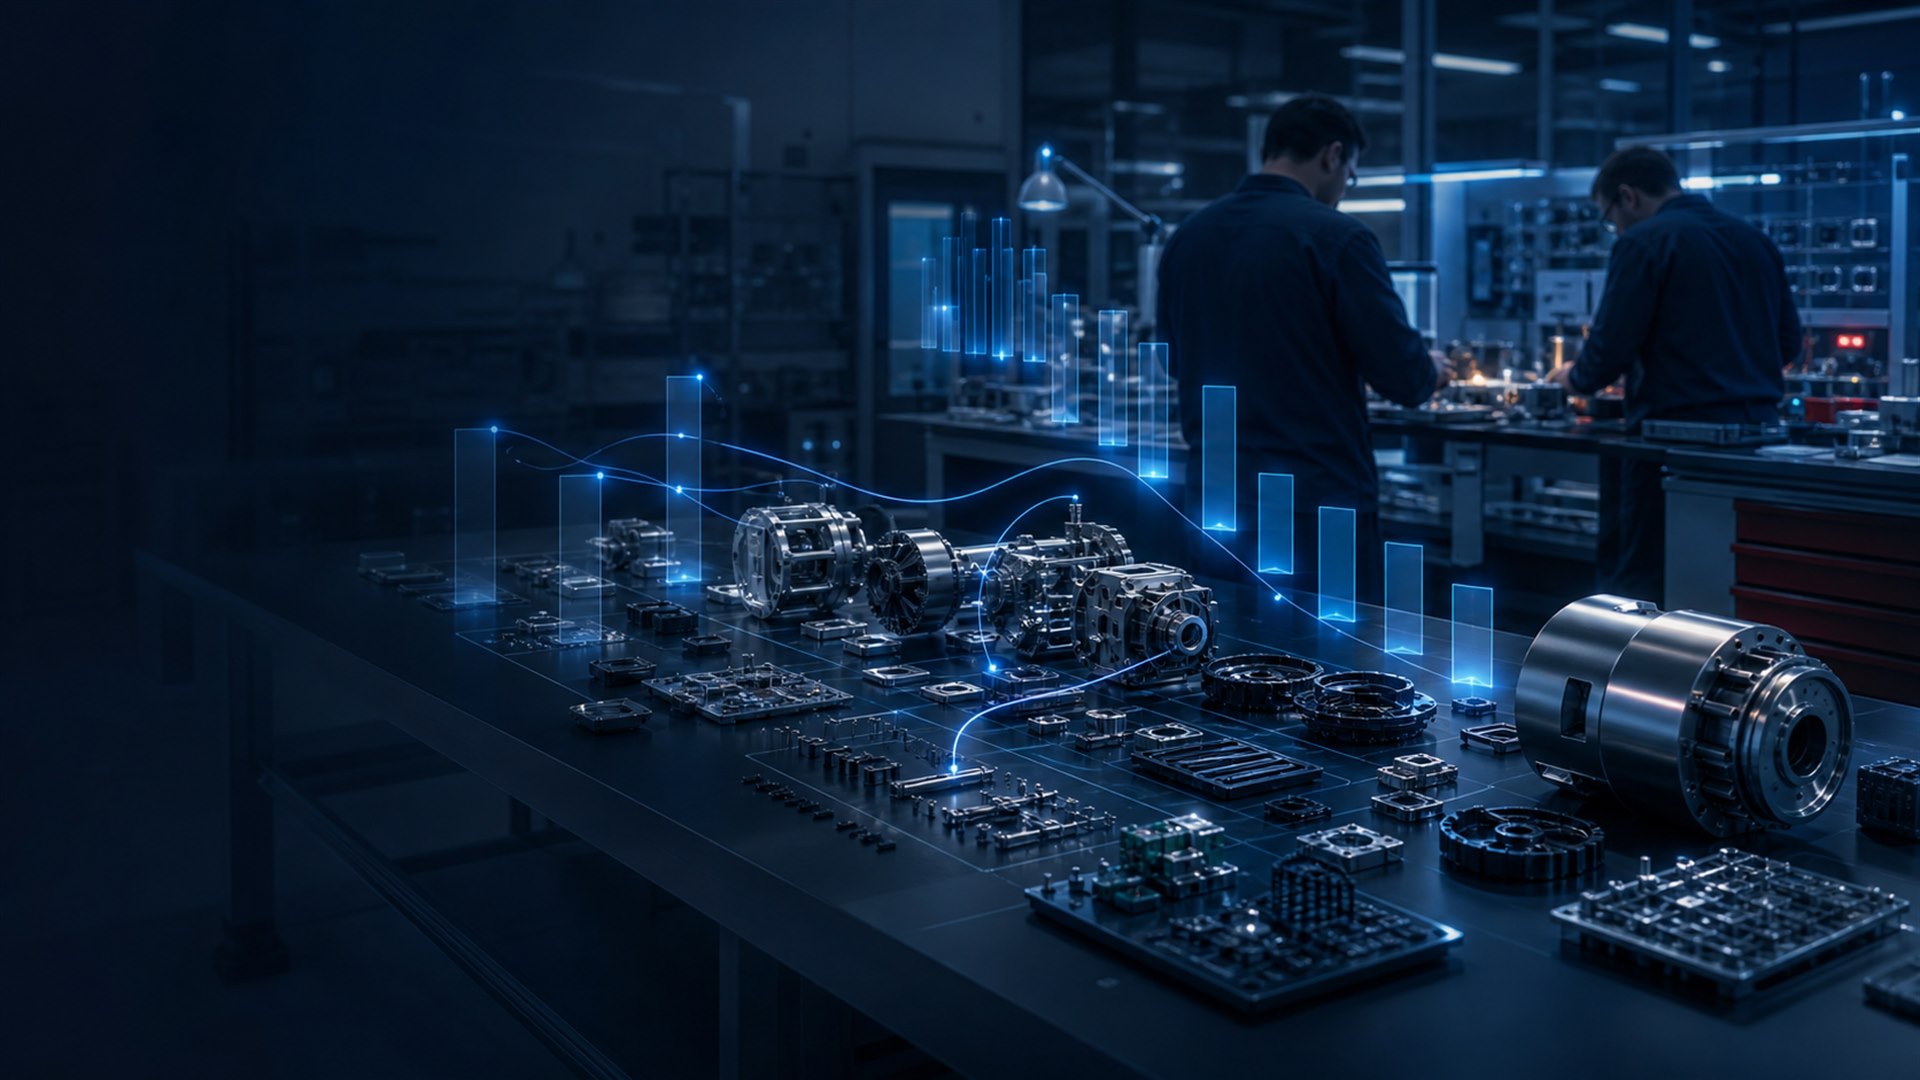
OEE, downtime and quality analytics that lift throughput and cut loss on the plant floor.

Optimization models that balance service, cost and capacity across your network and plants.

Production, asset, service and compliance analytics that bring your operation into one predictive picture.
Where operations analytics connects across the business.
Representative outcomes we engineer in this area.
Planning, supply and delivery in one live view.

A quantified, prioritised savings pipeline.

OEE and downtime analytics on the floor.
The technical engine that makes this work dependable in production.
The industries this work serves.
Representative problems teams bring to KEPLER here. Click any use case for the detail.
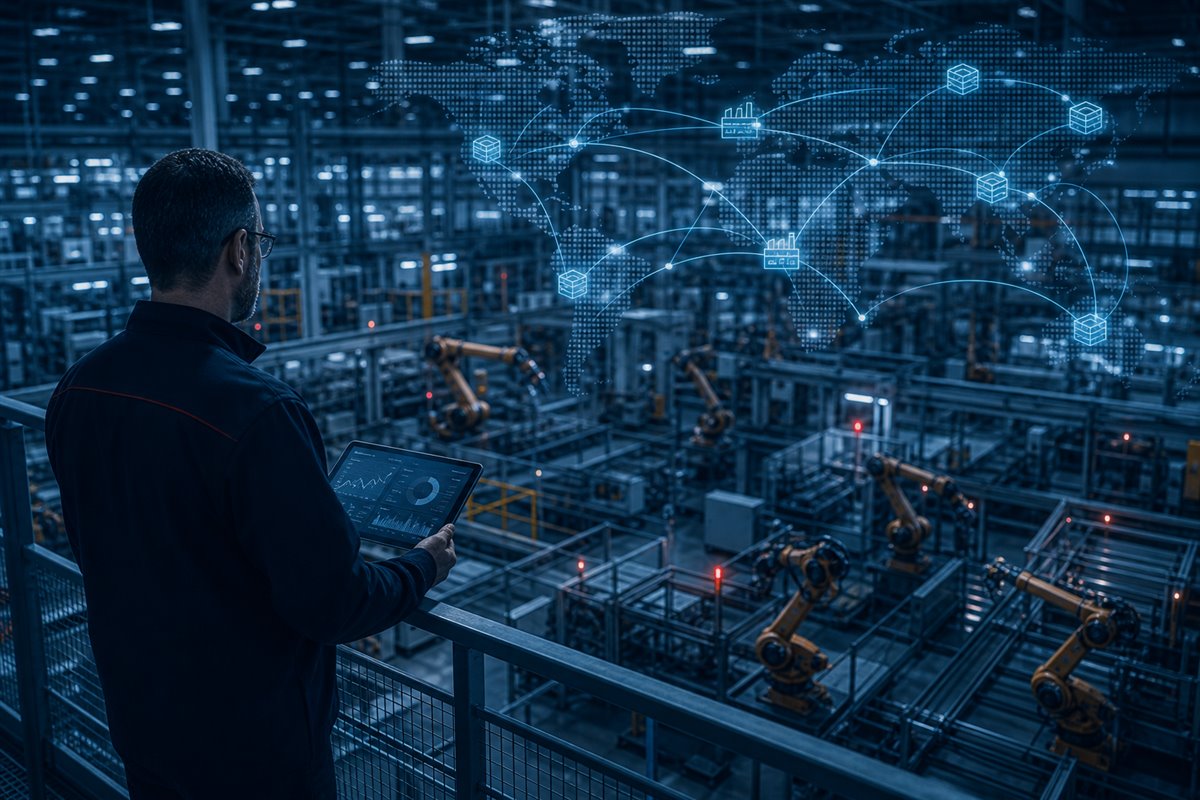
Real-time line visibility
View details →Machines and MES generate data all day, but it lands in reports the morning after. By the time a problem is visible, the shift that caused it is over.
Production issues caught and worked during the shift, not explained the day after.

Fewer defects escaping
View details →Defects surface at final inspection or, worse, at the customer, long after the process drifted. Root cause is a detective exercise across disconnected data.
Defects caught closer to their source, cutting scrap, rework and escapes.

~20% less unplanned downtime
View details →Run-to-failure means surprise breakdowns; fixed schedules mean servicing healthy machines. Both waste money, one in downtime, the other in labour and parts.
Fewer surprise breakdowns and less needless servicing, with maintenance aimed where it's due.
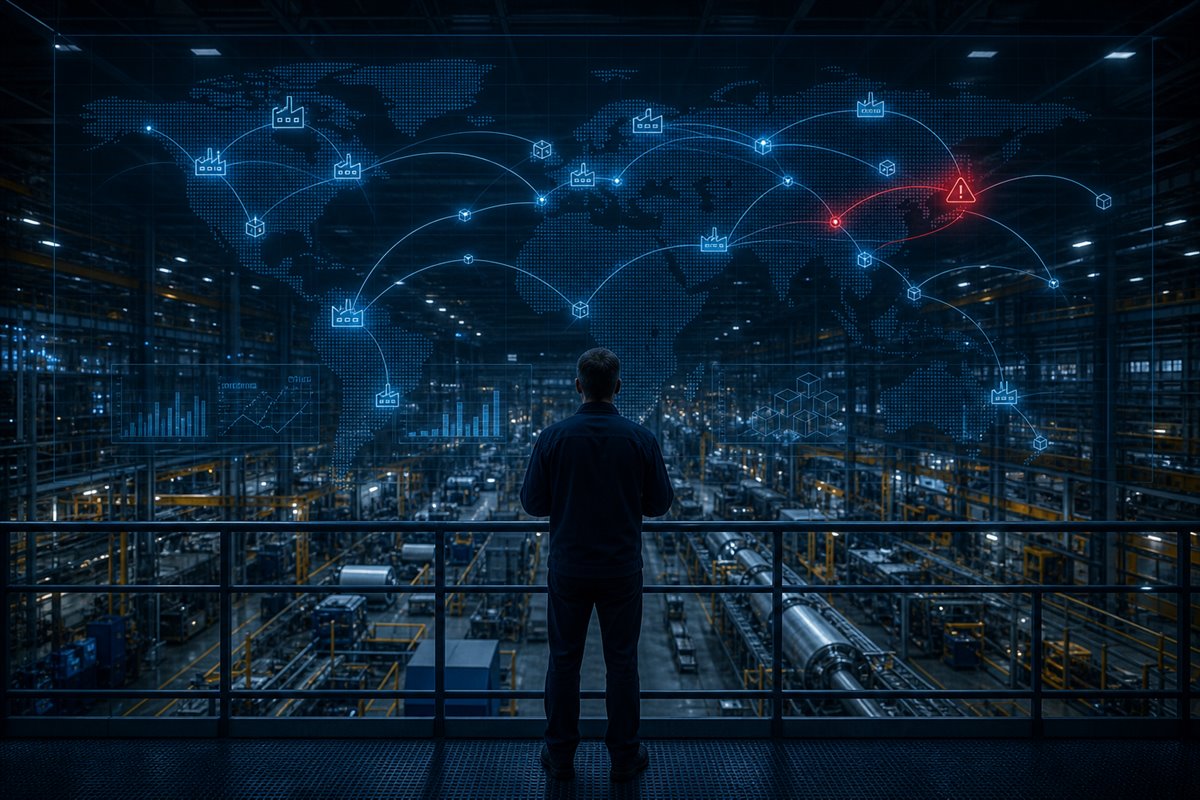
~40% fewer stockouts
View details →Planning, supply and delivery data sit in disconnected systems across plants and regions, so a disruption is only visible once it has already become a shortage.
Risk seen and worked before it turns into a stockout - on comparable builds, roughly 40% fewer (illustrative).

10–20% inventory freed
View details →Safety stock is set by habit, so cash is tied up in slow movers while the parts that matter still stock out. High inventory and poor service coexist.
Working capital released from the wrong stock while service on the right stock improves.

Faster replanning cycle
View details →Production plans are assembled by hand across spreadsheets. They take days to build, ignore real constraints, and are stale the moment demand or supply moves.
Plans that respect the constraints and can be redone in hours, so the schedule tracks reality.

Quantified process waste
View details →Everyone knows a process is slow or costly, but with no measurement the waste can't be sized, so it never rises up the priority list.
Operational waste measured and ranked, turning a vague sense of inefficiency into a costed action list.

Located true constraint
View details →More people are thrown at a slow process and it stays slow, because the real constraint is somewhere no one has identified.
The real bottleneck found and relieved, so throughput improves without just adding cost.

Best practice spread
View details →Sites doing identical work get very different results, and the good practices that explain the gap never get identified or shared.
The best-performing way of working identified and spread, lifting the laggards toward the leaders.
No use cases match this filter yet — but the problem is almost certainly one we can help with.
Ask us about your problem →