
Each plan in the automotive supply chain begins with a demand number. Capacity, purchasing commitments, inventory targets and supplier contracts all depend on it. When that number is wrong, the cost shows up in just about every corner of the automotive supply chain: idle production lines, expedited shipping costs, too much inventory, lost sales.
Automotive demand forecasting has historically been challenging. However, it has become increasingly difficult. According to S&P Global Ratings, the global automotive industry will stabilize at approximately 90 million light vehicle units per annum for the period from 2026 to 2028 (down from 92 million units in 2025), primarily due to lower demand in China and increased energy costs. Furthermore, the composition of automotive demand is changing rapidly in terms of combustion, hybrid and electric vehicles. Several battery electric models deviated from their sales forecasts by up to four times, above or below plan, during the first six months of 2025 (BCG).
Although data analytics cannot eliminate the inherent uncertainty associated with predicting demand for the automotive sector, it can make forecasts more accurate where demand is stable. Further, data analytics can show the range of possible outcomes in situations of high uncertainty and link those outcomes to specific business decisions. The remainder of this article will focus on how automotive manufacturers (original equipment manufacturers, or OEMs), tier-one suppliers and aftermarket organizations can utilize data analytics to enhance their ability to predict future demand for automotive components and related services.
From demand signals to decisions: automotive demand forecasting
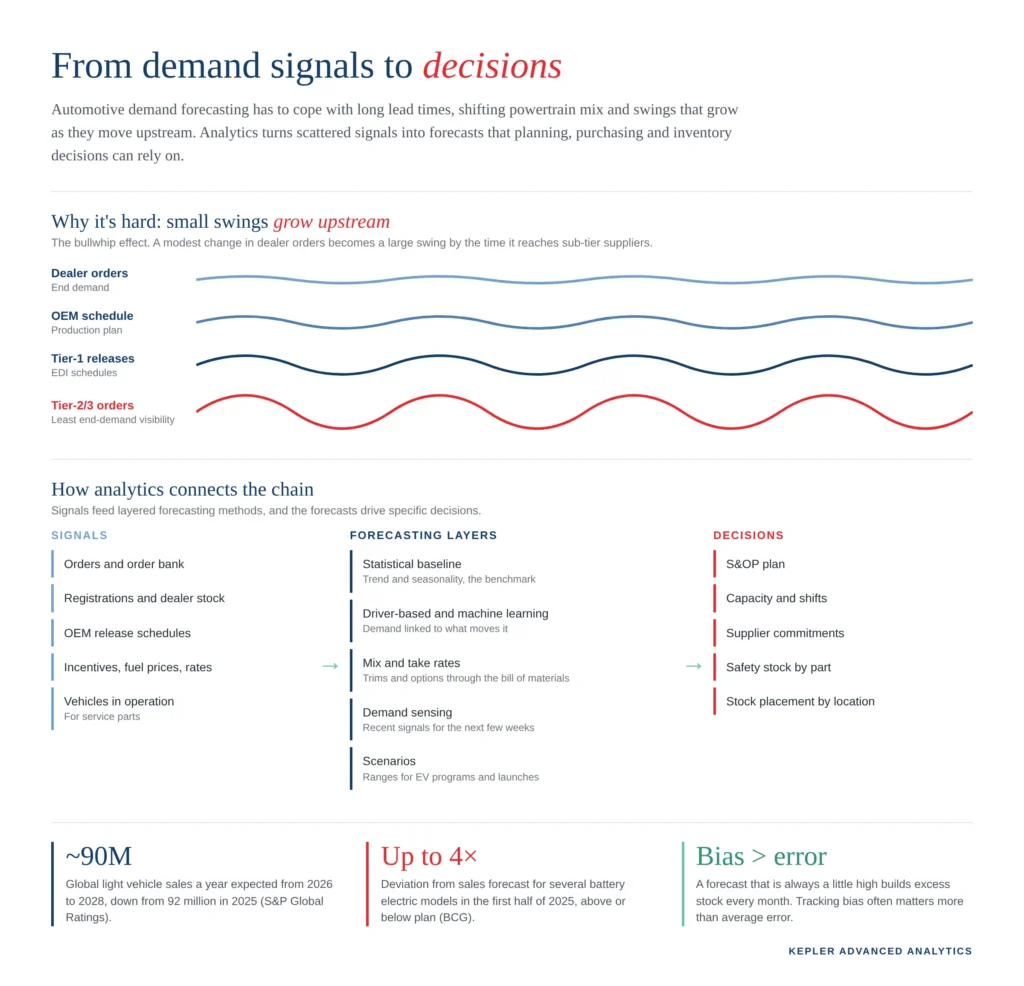
Why automotive demand is so hard to forecast
Forecasting demand for automotive components is challenging because several characteristics of the automotive sector create a unique environment relative to many other manufacturing industries. These include:
Long lead times. Because tooling and supplier agreements for many automotive components require months or years prior to the sale of the vehicle, forecasting errors made early are expensive to unwind.
Complexity of configuration options. Depending on the type of automobile being produced, individual models may be offered with hundreds of different configurations, including different engines, transmissions, interior trim colors and exterior colors. While total volume forecasts may be accurate, incorrect assumptions regarding the distribution of total volume among individual model configurations can result in either overproduction or underproduction of required parts.
Shifts in powertrain mix. The balance between combustion, hybrid and electric vehicles changes with incentives, fuel prices and new launches. Consequently, forecasted demand for automotive parts frequently shifts between traditional internal combustion engine-powered vehicles and hybrid and electric vehicles requiring entirely different types of parts.
Swings in policies and macroeconomic indicators. Tariffs, interest rates and fuel prices can cause significant fluctuations in demand within a quarter.
Bullwhip effect. Small variations in dealer orders are magnified as they flow upstream. OEM production schedules change, supplier releases change more, and sub-tier suppliers see the biggest swings.
Unpredictable releases. Supplier releases are typically based on OEM forecasts rather than current consumer demand. Moreover, many suppliers do not systematically evaluate the reliability of those forecasts.
Who forecasts what in the automotive supply chain
Demand forecasting refers to different activities depending on the position of the organization within the supply chain. The types of data used for forecasting, as well as the techniques employed and the major challenges faced, vary significantly throughout each level of the supply chain.
| Business | What it forecasts | Key inputs | Main challenge |
|---|---|---|---|
| Vehicle original equipment manufacturer (OEM) | Vehicle sales by model, market and powertrain | Registrations, dealer orders, order bank, incentives, macro indicators | Powertrain mix shifts and policy changes |
| Original equipment manufacturing planning | Option and trim mix, component requirements | Order configurations, take rates, bill of materials | Mix errors even when total volume is correct |
| Tier-1 supplier | Part volumes by customer program | OEM release schedules (electronic data interchange), program volumes, historical call-offs | Unreliable releases and delays in programs |
| Tier-2 and tier-3 supplier | Raw material and component volumes | Tier-1 orders, limited end-demand visibility | Bullwhip effect and late demand visibility |
| Aftermarket and service parts | Spare and replacement part demand | Vehicles in operation, failure rates, dealer and distributor sales | Intermittent, slow-moving demand across multiple stock keeping units (SKUs) |
An effective forecasting program should start with a clear definition of which challenges it is addressing. An original equipment manufacturer’s vehicle sales forecast will not assist a tier-1 supplier with forecasting uncertain releases.
How data analytics improves automotive demand forecasting
While most automotive companies continue to rely on spreadsheets, statistical software packages or their enterprise resource planning (ERP) systems’ planning modules for forecasting purposes, data analytics provides a wide variety of benefits. Five primary areas where data analytics enhances forecasting capabilities include:
Strong statistical baseline
Historical time-series methods capture trends and seasonalities from historical data. On their own they are limited, but they provide a baseline for evaluating the performance of other forecasting methodologies. Unfortunately, many companies do not possess even this basic capability; thus, forecasts are developed solely by relying on individual judgments.
Driver-based and machine learning models
Unlike time-series models that rely on history alone, driver-based models utilize the specific factors that affect demand (e.g., incentives, fuel prices, interest rates, model introductions, dealer stock levels, competitor pricing). Additionally, machine learning models can analyze multiple drivers simultaneously and identify relationships between them that traditional models overlook. Their effectiveness depends upon having sufficient historical data that relates to the identified drivers and ensuring that those drivers are measured consistently.
Mix forecasting
Rather than developing separate forecasts for each part required for a given vehicle configuration, these models (i.e., mix modeling) forecast how vehicle volume will split across various trims and options. Once the overall vehicle volume is known, the mix can be exploded through the bill of materials to generate accurate forecasts for each component part. Thus, each part forecast remains consistent with the corresponding vehicle volume forecast.
Short-term demand sensing
In addition to longer-term forecasting capabilities, demand-sensing models focus on accurately projecting near-term demand (for the next few weeks). These models assign greater weights to recent signal data (e.g., recent dealer orders and orders booked into the order bank, recent registration activity, recent point-of-sale data).
Scenario modeling under conditions of high uncertainty
Given that a single forecast number is insufficient to represent likely future demand when uncertainty is high (as with electric vehicle programs or new model introductions), scenario-modeling techniques provide a range of potential outcomes (e.g., low-, base- and high-adoption scenarios) along with implications for capacity, inventory levels and supplier commitments. Decision-makers can then test their decisions against a range of plausible futures rather than making decisions against a single guess.
The table below illustrates comparisons between these methods.
| Method | Best for | Data needed | Watch-outs |
|---|---|---|---|
| Statistical time series | Stable, mature products that have established baselines | At least two to three years of clean history | Misses turning points and new drivers |
| Driver-based and machine learning | Products whose demand responds to measurable factors | Historical data plus data related to identified drivers | Harder to explain than traditional methods; requires consistent driver data |
| Mix and take-rate models | Option-rich vehicles and component planning | Order configurations, take rates, bill of materials | Bill of materials accuracy is critical |
| Demand sensing | Short-term adjustments, weeks ahead | Recent orders and orders booked into the order bank, recent registration activity, recent point-of-sale | Adds little beyond the near term |
| Scenario modeling | EV programs, launches and policy-driven demand | Assumptions, market data, capacity and cost data | Scenarios must be linked to real decisions |
| Intermittent demand methodology | Service and aftermarket parts | Part-level sales histories, vehicles in operation | Standard error metrics can misrepresent slow-moving demand across multiple SKUs |
Improving forecast quality for tier-1 suppliers: assessing release reliability
Tier-1 suppliers have a particularly problematic situation: they plan their production output based upon OEM release schedules that can change substantially between the initial forecast and final firm order.
Analytic tools enable assessing how reliably OEMs make their releases. By comparing historical releases with actual customer takes on parts (and doing this by customer, program, part and time horizon), patterns emerge that indicate when suppliers can safely assume reliability in releases and when they must adjust incoming releases before assuming them. Moreover, this analysis enables suppliers to engage in more informed discussions with OEMs about release unreliability.
The same analytical approach supports identifying opportunities for improving communication with customers about their releases. By showing an OEM how variable its releases have been historically, and what that variability has cost in premium freight costs and excess inventory storage costs, suppliers demonstrate a more compelling case than simply complaining about variability.
Forecasting for service and aftermarket parts
Service parts are distinct from production parts because they exhibit intermittent demand; a part may sell nothing for weeks and then several units at once. Additionally, service parts exhibit a high degree of SKU proliferation (often tens of thousands); however, most service parts are slow movers (i.e., infrequently ordered).
As such, methods designed specifically to accommodate intermittent demand are more successful than traditional time-series approaches in this space. Similarly, linking forecasts to vehicles in operation (i.e., how many vehicles of each model and year are currently active on roads, and how frequently each part fails or wears out) facilitates improved forecasting success.
Why forecast quality matters for aftermarket service
In aftermarket organizations, as with production organizations, achieving high-quality forecasts is essential to achieving desired service levels and optimal inventory placement strategies. A US-based distributor of industrial hose and fluid sealing products demonstrates how much is at stake. Kepler Advanced Analytics utilized network design coupled with inventory optimization for this company to strategically place inventory adjacent to actual demand experienced at each location. As a result, service-level coverage rose from 64% to 99.3%, transportation costs declined by 15–20% and miles per delivery decreased by approximately 40%.
Measuring forecast quality
A forecast that is not regularly evaluated can never improve. The metrics below cover most needs. The important thing is to track them consistently, at the level where decisions are made.
| Metric | What it shows | When to use it |
|---|---|---|
| Mean absolute percentage error (MAPE) or weighted mean absolute percentage error (WMAPE) | Average size of forecast error | General accuracy tracking; WMAPE avoids distortion caused by low-volume items |
| Bias | Whether forecasts are typically too high or too low | Always; persistent bias leads to excess inventory or shortages |
| Forecast value added | Whether each step in the process improves forecast accuracy | Reviewing the planning process and any overrides entered by planners |
| Accuracy of the mix | How well option and trim split predictions were made | OEM and component planning |
| Reliability of releasing | How much customer releases changed before being locked in | Tier-1 and tier-2 suppliers |
| Fill rate and service level | Whether forecasted quantities were available at the time needed | Aftermarket and service parts |
Bias often matters more than average error. A forecast that is 10% off in random directions is manageable. One that is consistently 10% high builds excess stock every month.
From better forecasts to better decisions
Forecasting earns its value only when it changes decisions. In automotive, the main links are:
- Sales and operations planning (S&OP). A single, agreed forecast that sales, operations, procurement and finance all plan from.
- Capacity planning. Line rates, shifts and investment decisions based on scenarios, not a single volume.
- Procurement commitments. Volume commitments and supplier capacity reservations sized to the forecast range, with flexibility built in where uncertainty is high.
- Inventory targets. Safety stock set by forecast error and lead-time variability for each part, not a flat number of days.
- Supplier risk. Volume swings strain suppliers. Sharing better forecasts, and the uncertainty around them, helps suppliers plan and reduces the risk of failures caused by stranded capacity.
Procurement visibility supports this chain. A procurement control tower built for one of the leading players in the North American commercial truck market brought supplier, purchasing and commodity data into a single view and cut lead time by 80%. Shorter, more reliable lead times reduce how far ahead demand has to be forecast, which makes every forecast easier.
Common pitfalls
- Forecasting total volume and ignoring mix. Parts are driven by mix. A correct total can still leave the wrong parts on the shelf.
- Planning directly to OEM releases. Without measuring release reliability, suppliers inherit every swing.
- Overriding models without tracking results. Planner judgment adds value in some cases and destroys it in others. Forecast value added shows which.
- Using one method for everything. Production parts, new launches and service parts need different approaches.
- Treating the forecast as a single number. Where uncertainty is high, a range with scenarios is more honest and more useful.
- Weak data foundations. Inconsistent part numbers, missing history and unreliable bills of materials undermine any model.
Getting started with analytics-based demand forecasting
A practical sequence often looks like this:
- Define the decision. Be clear about what the forecast will drive (capacity, purchasing, inventory) and at what level and horizon.
- Clean the history. Consolidate sales, orders, releases and shipments. Fix part number changes and remove one-off events.
- Build a baseline. Set up a statistical baseline and measure its accuracy and bias.
- Add drivers and mix. Bring in demand drivers, option take rates and bill of materials data where they improve accuracy.
- Add scenarios. For EV programs, launches and policy-sensitive products, model a range of outcomes.
- Connect to planning. Feed forecasts into S&OP, inventory targets and supplier commitments.
- Measure and refine. Track accuracy, bias and forecast value added each month and adjust.
How Kepler Advanced Analytics can help
Kepler Advanced Analytics helps vehicle OEMs, tier-1 suppliers and aftermarket businesses improve automotive demand forecasting with data analytics built on their existing ERP, sales and planning data. The team combines automotive supply chain expertise with analytics engineering and an offshore delivery model.
Typical support includes:
- Forecasting diagnostic: measuring current accuracy, bias and forecast value added to show where errors come from
- Statistical and machine learning forecasting models for vehicles, components and service parts
- Mix and take-rate forecasting linked to bills of materials
- Release reliability analysis for tier-1 and tier-2 suppliers planning to OEM schedules
- Scenario modeling for EV programs, launches and policy-driven demand
- Inventory and network optimization that turns better forecasts into better service levels and lower stock
- Planning dashboards in Power BI or the client’s preferred BI tool for S&OP and demand reviews