
Ask an OEM purchasing team about its tier-1 suppliers and the answers come quickly. Contracts, scorecards, audit results, the date of the last business review: it’s all on file. Ask who makes the chip inside a tier-1’s control module, though, or which foundry pours a particular housing, or where the magnets in an e-motor were refined, and the room tends to go quiet.
That silence is a problem, because plenty of disruptions begin below tier 1. One tier-2 or tier-3 source can quietly sit behind several tier-1 suppliers at the same time. When it fails, several vehicle programs feel it together. Tier-2 and tier-3 supplier visibility means mapping those sub-tier sources, tying each one to the parts and programs that rely on it, and keeping a close enough eye on them to act early.
What follows looks at why sub-tier visibility is so hard to get in automotive, where the blind spots tend to sit, the main ways companies build a multi-tier map, how to measure progress, and where to start.
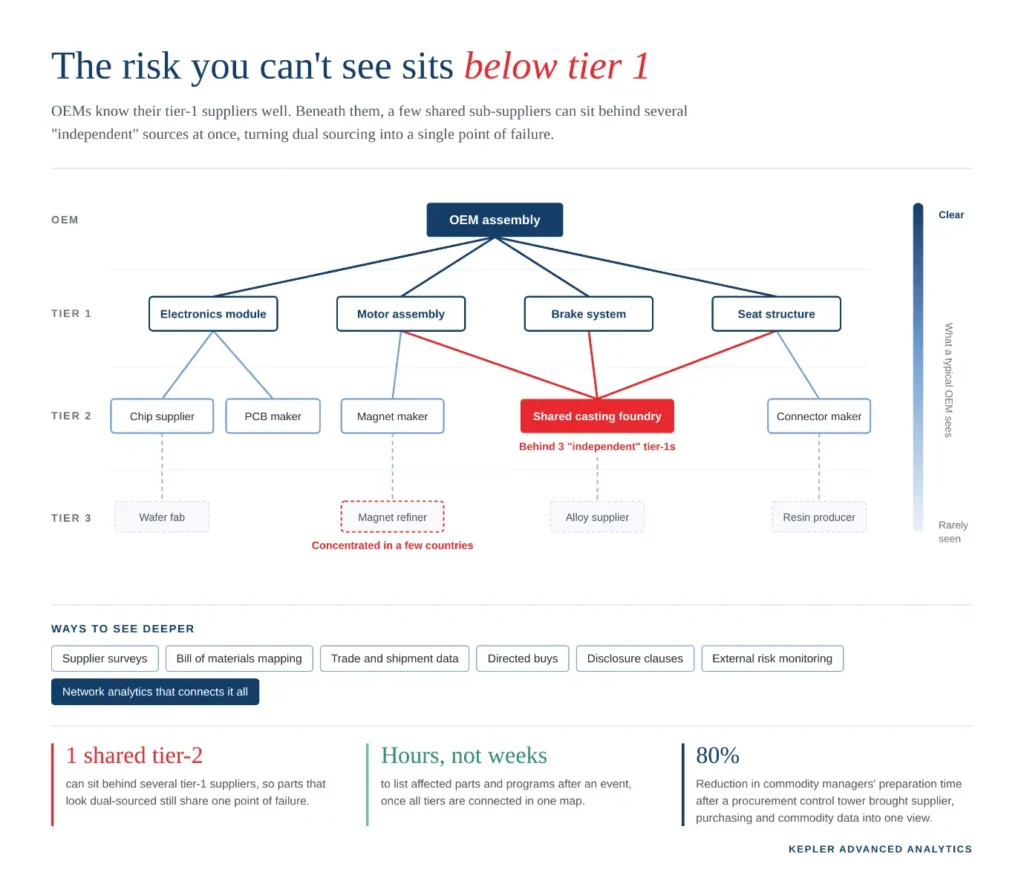
What the OEM sees and what sits beneath
Why sub-tier visibility is so hard
Effort usually isn’t what’s missing. The obstacles are baked into how automotive supply chains are put together.
For one thing, OEMs sign contracts with tier-1 suppliers, not with whoever supplies them. So there’s often no commercial or legal footing for asking a tier-2 for anything. Tier-1s, for their part, can see their own sources as competitive information and keep disclosures to a minimum.
Then there’s scale. A single vehicle program may pull in hundreds of tier-1 suppliers, and each of those has dozens of its own. Every extra tier multiplies the relationships.
Some parts are simply hard to see. Chips, connectors and other small electronics usually arrive buried inside a module, so the OEM’s purchase order lists the module and nothing about its contents.
And the picture keeps moving. New programs, cost-down drives, capacity shifts and acquisitions all reshuffle sub-tier sources, which means a map drawn once is out of date surprisingly fast. Whatever data does exist is scattered across supplier surveys, quality files, customs records and the tier-1’s own systems. It’s rarely in one place.
All of this is part of the wider set of supply chain challenges in automotive industry operations, and it goes a long way toward explaining why so many disruptions land as a surprise.
Where sub-tier risk usually hides
Risk isn’t spread evenly. The commodities that cause the most trouble usually have three things in common: global supply concentrated in a handful of places, long requalification times if a source has to change, and very little that shows up in the OEM’s own data.
| Component or material | Typical sub-tier source | Why it’s a blind spot | Typical disruption |
|---|---|---|---|
| Semiconductors and memory | Chipmakers and foundries supplying tier-1 electronics makers | Chips arrive inside modules; few OEMs buy them directly | Allocation, export disputes, competition from other industries |
| Rare earth magnets | Magnet makers and refiners behind motor and actuator suppliers | Refining is concentrated in a few countries | Export controls, price spikes |
| Castings and forgings | Foundries and forge shops serving tier-1 assemblers | Many small, specialized suppliers with limited capacity | Capacity shortfalls, financial distress, quality escapes |
| Wire harness components | Connector, terminal and cable makers | Thousands of low-cost parts with few alternative sources | Single-source failures, long requalification |
| Plastic resins and compounds | Resin producers and compounders behind molders | Specific grades approved for each part | Plant outages, force majeure declarations |
| Battery materials and cells | Cell makers, cathode and anode producers, refiners | New supply base with little history | Concentration, sourcing rule changes |
| Printed circuit boards | Board fabricators behind electronics suppliers | Multiple tiers within electronics alone | Lead-time swings, component shortages |
If tier-2 and tier-3 supplier visibility is going to pay off anywhere first, it’s usually in these categories.
Ways to build tier-2 and tier-3 supplier visibility
There’s no single method that shows the whole picture. Most programs mix several, and they begin with the parts that would hurt most if supply stopped.
- Supplier surveys and declarations
The usual opening move is simply to ask. Tier-1 suppliers name their key sub-suppliers, plant locations and critical materials for specific parts. Response quality depends a lot on the ask: short surveys aimed at critical parts, repeated on a schedule, get far better answers than long questionnaires sent to everyone.
- Bill of materials mapping
Bills of materials, drawings and specifications show what goes into each part, down to materials and sub-components. Put them next to the survey answers and the map can run all the way from the finished vehicle to raw material, at least for the parts in scope.
- Trade and shipment data
Customs and shipment records show who ships to whom. Now and then they expose a sub-tier link a supplier never mentioned. Coverage isn’t even across countries and routes, though, and matching company names takes real care.
- Directed buys and controlled sourcing
For a small number of critical components, some OEMs pick or negotiate with the sub-tier source themselves, even though the tier-1 still places the order. Visibility for those parts becomes complete. The trade-off is more commercial involvement for the OEM.
- Data sharing agreements
Contracts can oblige tier-1 suppliers to disclose sub-tier sources for critical parts and to flag any change. Getting these terms agreed takes time. Once they’re in place, though, visibility stops being a special project and becomes part of the normal supplier relationship.
- External risk monitoring
Once a sub-tier source is known, it can be watched: news, financial signals, sanctions lists, trade data. These outside signals catch the events no survey would ever predict, like a fire, a flood, a new export control or an insolvency.
- Analytics to connect it all
Analytics is what turns these separate sources into one multi-tier network linked to the OEM’s own parts, programs and spend. Network analysis on top of that shows where many paths funnel through the same sub-supplier, and how far a problem at any one point would travel.
The approaches compare like this.
| Approach | What it reveals | Strengths | Limitations |
|---|---|---|---|
| Supplier surveys and declarations | Named sub-suppliers, sites and materials | Direct from the source; easy to start | Depends on supplier willingness; goes stale |
| Bill of materials mapping | Materials and sub-components in each part | Ties the map to real parts and programs | BOM accuracy and depth vary |
| Trade and shipment data | Shipping relationships between companies | Reveals undisclosed links | Gaps by country; name matching needed |
| Directed buys and controlled sourcing | Full visibility for chosen components | High control over critical parts | More commercial effort; limited scope |
| Data sharing agreements | Ongoing disclosure and change notices | Makes visibility routine | Slow to negotiate across many suppliers |
| External risk monitoring | Events affecting known sub-suppliers | Catches sudden disruptions | Only works once sub-suppliers are known |
| Network analytics | Shared sub-suppliers and how far a disruption would spread | Turns lists into a usable risk view | Only as good as the data feeding it |
From a sub-tier map to real risk insight
Names on a spreadsheet don’t change much on their own. The map starts earning its keep once it’s plugged into the OEM’s own parts, programs and spend data.
Concentration is usually the first surprise. Two or three tier-1 suppliers that look completely independent can turn out to lean on the same tier-2 foundry or chip supplier, which means a part that’s dual-sourced on paper actually shares one point of failure. Exposure comes next: once every sub-supplier is tied to the parts and vehicle programs it supports, it’s plain how much revenue rides on each one.
Speed is the other big gain. When a fire, flood or export ban hits a region or a company, someone has to answer “which parts and programs are affected?” With a connected map that takes hours. Without one it can drag on for weeks, by which point the options have narrowed. Sourcing for new programs improves too, since buyers can weigh sub-tier concentration alongside tier-1 price and capability.
Sub-tier data also feeds into broader supplier risk analytics in the automotive industry, adding a layer tier-1 scorecards can’t supply on their own.
Prioritizing what to map
Mapping every part down to tier 3 isn’t practical, and it isn’t needed. A tiered approach puts the effort where the risk sits.
| Priority | Which parts | Mapping depth | Refresh |
|---|---|---|---|
| Critical | Single-source, safety-critical or long-requalification parts; concentrated commodities such as chips and magnets | Tier 2 and tier 3, down to key materials | Quarterly, plus change notices |
| High | High-spend or high-volume parts with limited alternatives | Tier 2, with key materials | Every six months |
| Medium | Parts with qualified alternatives but some concentration | Tier 2 for main sub-suppliers | Annually |
| Low | Standard, easily replaced parts | Tier 1 only | As needed |
Measuring progress
It’s tempting to count surveys sent. That number says almost nothing. Coverage is the better place to start: what share of critical parts have a known tier-2 source, and how many can be traced to tier 3 or to the raw material? Spend coverage asks the same question in money terms, as the share of direct material spend linked to mapped sub-suppliers.
Then there’s what the map has actually turned up, chiefly the hidden single points of failure, meaning sub-suppliers sitting behind several tier-1s or programs. Freshness matters as well (how many critical part records were confirmed within the agreed refresh period?), and so does speed after an event, measured as the time it takes to list every affected part and program. Finally, count the mitigations closed out: second sources qualified, buffers set, contracts updated for the high-risk nodes.
Turning visibility into action
None of the responses are exotic once the critical sub-tier risks are out in the open. Where a hidden single point of failure turns up, the obvious move is to qualify an alternative source. Parts tied to fragile sub-suppliers can get targeted buffer stock instead of a blanket inventory increase, which fits neatly into wider automotive inventory optimization. For the handful of truly critical components, directed buys make sense, and new contracts for critical parts can carry disclosure clauses. The highest-exposure nodes deserve worked-out scenarios, so a response is ready before anything happens.
Monitoring then has to become routine, ideally through a control tower that brings supplier, order and risk data into one view. That single view matters more than it might seem. For one of the leading players in the North American commercial truck market, Kepler Advanced Analytics built a procurement control tower that pulled supplier, purchasing and commodity data together and cut commodity managers’ preparation time by 80%. Feed sub-tier data into a view like that and the same teams see deeper risks without anyone building a new report.
Common pitfalls
The most common mistake is trying to map everything at once. Blanket surveys sent to every supplier bring back few answers, and the data that does come back rarely gets used. A close second is treating the map as a one-off project; sub-tier sources change all the time, so without a refresh routine the map decays.
Names collected without links to parts are another dead end, since a sub-supplier list only helps once it’s connected to parts, programs and spend. Shared sub-suppliers get overlooked surprisingly often, even though the tier-2s sitting behind several tier-1s are usually where the biggest risks hide. It also pays to keep the tier-1 relationship in mind. Visibility works better as a joint effort than as an audit. And every high-risk node needs someone who owns the response, with a mitigation plan everyone has agreed to.
Getting started with tier-2 and tier-3 supplier visibility
Start small, with the parts that would hurt most: single-source, safety-critical and concentrated commodities. Before reaching below tier 1, clean up the tier-1 base itself, matching supplier records and linking each tier-1 to its parts and programs.
From there, survey the relevant tier-1 suppliers for key sub-suppliers, sites and materials on those parts, then fill the gaps with BOM and trade data, cross-checking what suppliers say against other sources. Build the network view next. Connect every tier to parts, programs and spend, and look for shared sub-suppliers. Add monitoring of financial, news and trade signals for the high-priority names. The last step never really ends: agree mitigations for high-risk nodes and refresh the map on a fixed cycle.
How Kepler Advanced Analytics can help
Kepler Advanced Analytics helps vehicle OEMs and tier-1 component suppliers build tier-2 and tier-3 supplier visibility from the purchasing, bill of materials and supplier data they already hold, as part of Kepler’s wider automotive data analytics services. The team brings automotive procurement and supply chain know-how together with analytics engineering, delivered through an offshore model.
Work usually begins with deciding which critical parts to map first. From there it can cover supplier survey design and data consolidation for tier-2 and tier-3 sources, enrichment with bill of materials and trade data where disclosures fall short, and multi-tier network analysis that exposes shared sub-suppliers and hidden single points of failure. Sub-tier risk monitoring links each node to parts, programs and spend, and procurement control towers bring supplier performance, orders and sub-tier risk into a single view. Broader procurement analytics covers spend, should-cost and supplier performance.
Recent Posts
- Tier-2 and Tier-3 Supplier Visibility in Automotive Supply Chains: Seeing Risk Before It Reaches the Line
- Procurement Analytics for Automotive Manufacturers: Converting Spend Data into Cost Reductions, Lower Supplier Risk and More Effective Negotiations
- Automotive Inventory Optimization: Techniques and KPIs for Finding the Right Amount of Stock in the Right Places at the Right Time
- Automotive Demand Forecasting Using Data Analytics: More Accurate Plans for a Changing World
- Supplier Risk Analytics in the Automotive Industry: Spotting Supplier Trouble Before It Stops the Line